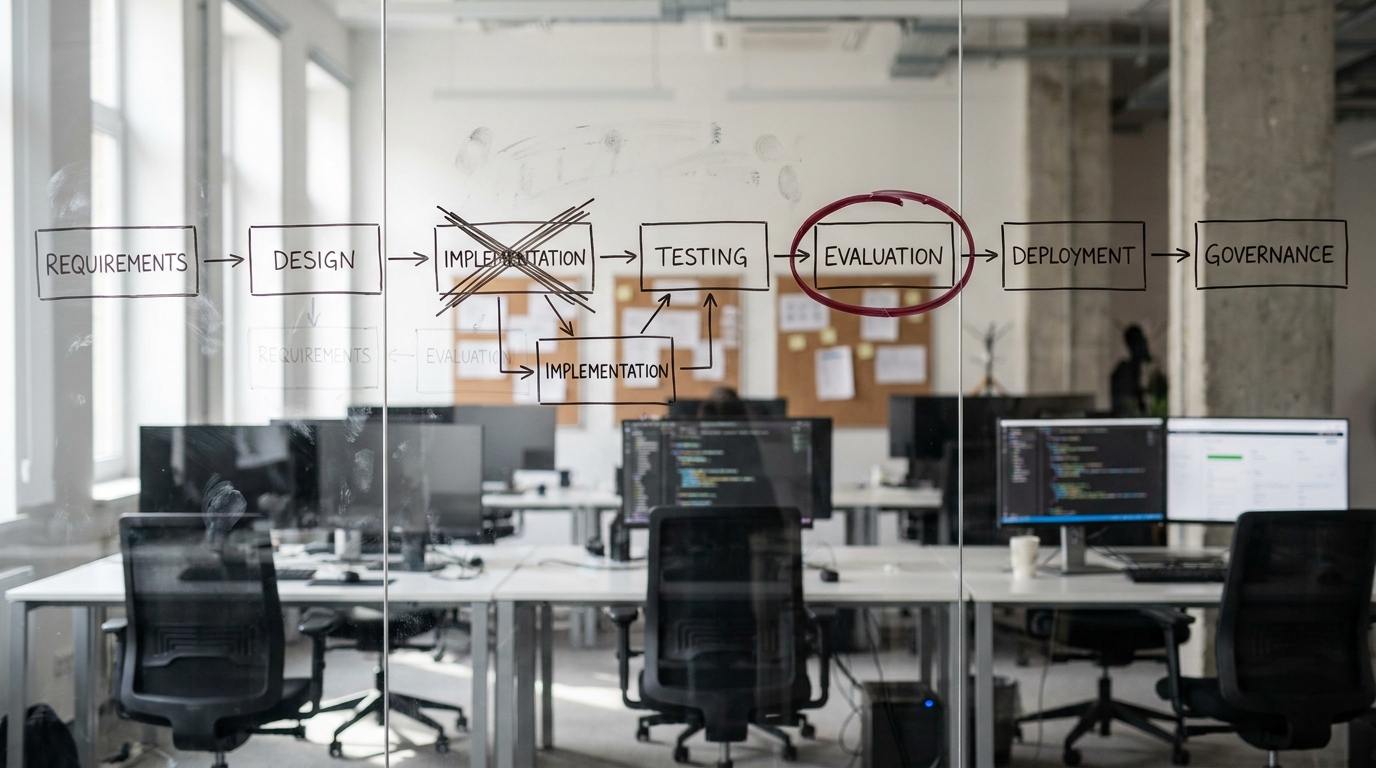

Every test passed. The feature has been wrong for six weeks.
Both statements are true at once, and nothing in the operational playbook you already trust is built to hold them together. The request succeeded. The p99 latency stayed inside its budget. The error rate never moved. A wrong answer returns HTTP 200, and the first detector to fire was a support ticket.
Engineering leaders who own a live AI feature keep arriving at the same position. The pre-launch evaluation suite passed . The dashboards are green. And the honest answer to "is it working right now" is "nobody has complained today." That is a hope, not a monitoring strategy, held by an organization that has already staked budget and roadmap on the feature performing.
What follows is the inventory that closes it: six categories of signal a production AI feature actually needs, what each one tells you that the others cannot, which of them deserve to wake a human at three in the morning, who should own the response, and what a minimum viable version looks like if you start on Monday with nothing.
An AI feature can fail while every dashboard stays green
Traditional observability was built for systems where "the service returned a response" and "the service did its job" are the same sentence. For deterministic software that assumption holds well enough to run a business on. Something throws, something increments, something fires.
An AI feature breaks that equivalence. The failure you care about raises no exception, triggers no retry, and produces no log line that looks unusual next to the thousands around it. Trace it end to end and you find a 200, a few hundred milliseconds, a clean span tree, and an output nobody checked.
Silent degradation reaches production in three shapes, and they need different detectors:
- The model changed underneath you. Rolling and tiered model aliases can resolve to a new checkpoint without the string changing, though pinned snapshot identifiers do not - Anthropic (2026) documents its dateless IDs as fixed snapshots that never silently resolve to a successor. Your prompt is the same, your code is the same, and the behaviour moved overnight.
- The inputs changed. Users started asking a kind of question the prompt was never designed to handle. Two months after launch, the traffic mix rarely resembles the traffic mix you tested against.
- The context changed. A retrieval corpus went stale, an upstream data source started returning something subtly different, or a document set was re-indexed and the ranking shifted.
None of the three produces an error. All three produce wrong answers. Every signal category below exists to make one of them visible before a customer does it for you.
What AI observability actually means
AI observability is the practice of collecting enough signal about a feature's behaviour, cost, and output quality to answer "is this still working, and why" without waiting for a user to tell you.
Define the terms once, because this field uses them loosely. An LLM is a large language model. TTFT is time to first token, the delay before a streaming response starts producing text. An SLO is a service level objective, the target you hold yourself to and alert against. RAG is retrieval-augmented generation, where the system fetches documents and puts them into the prompt before generating.
One distinction earns its place, and then we can leave it alone. Classical monitoring answers whether the system is up. AI observability answers whether the system is right. Both matter. The second is the new work, and it is new work because rightness is not a status code.
This applies well beyond chat interfaces. Classification, extraction, ranking, summarization, and multi-step agent workflows all fail the same quiet way. If a model output flows into a decision your business acts on, the feature is in scope.
Here is the full inventory, organized by the decision each category drives rather than by which dashboard happens to display it. The six sections after it are this table, unpacked.
| Signal category | What you measure | What it tells you | What decision it drives |
|---|---|---|---|
| Latency | TTFT, generation time, end-to-end p50/p95/p99 | Where the time is actually spent | Change model, change architecture, or change nothing |
| Cost | Tokens by feature and prompt version, cost per successful outcome | Whether unit economics survive scale | Prompt, model, or caching change |
| Output quality | Groundedness, factual accuracy, instruction adherence, refusal rate | Whether the answers are right | Roll back a version, or expand the feature |
| User satisfaction | Regeneration, edit, abandonment, escalation-to-human rate | Whether quality problems change behaviour | Prioritize the fix, or leave it |
| Drift | Input distribution distance, output distribution shift, retrieval hit rate | Whether the world moved under you | Re-tune, re-index, or re-evaluate |
| Operational health | Availability, errors, timeouts, rate limits, fallback activation | Whether it is the model or the plumbing | Infrastructure response, or model response |
Latency, and why one number hides three problems
Most teams track a single latency figure for their AI feature and optimize against it. That number averages three things that move independently, which is why the optimization so often lands in the wrong layer.
Time to first token governs perceived speed in any streaming interface. A user watching text appear judges the product on this and nothing else. Total generation time governs the cost of a slow tail and the timeout budget of anything downstream. End-to-end feature latency includes everything around the model call, and it is the only one your user experiences.
Open a real trace and the time distributes across retrieval, prompt assembly, model inference, tool calls, and post-processing. Multi-step agents compound this in a way that surprises people the first time they look. The single run sitting in your p99 may be making twelve model calls, and no individual call in it is slow.
Two practical notes. Report percentiles. An average latency on a long-tailed distribution describes nobody's experience, so the number you quote in a review will be a number nobody in the room has ever had. And instrument each layer separately from day one, because a blended figure tells you something is slow without telling you which team should be looking at it.
The decision this category drives is narrow and useful: a smaller model, a different architecture, or nothing at all. The next category decides whether any of those options are affordable.
Cost, and the attribution problem underneath it
The monthly bill is the least useful view of AI cost, and for most organizations it is the only view they have.

What you need is spend broken down by feature, by prompt version, by user cohort, and ideally by individual request. Without that decomposition, a cost anomaly is a mystery with no path to resolution. With it, a spike resolves in minutes.
Direction matters here, and it is commonly reversed. Output tokens cost several times more than input tokens - roughly 5x at Anthropic and 6x at OpenAI as of August 2026 (CloudZero, 2026) - so generation length drives the bill, while prompt growth compounds through sheer request volume instead. Adding a few paragraphs of instruction to a prompt served ten thousand times a day is a budget decision, not a wording decision, and it rarely gets treated as one.
The runaway modes to instrument for specifically:
- Agent loops that retry, where a single failed run consumes twenty model calls instead of two.
- Retrieval that quietly grows the context window as a corpus expands.
- Chatty tool-use patterns that nobody profiled because each individual call is cheap.
The metric that matters most is cost per successful outcome, not cost per call . A cheap wrong answer is not cheap. It consumes a support interaction, a retry, and some fraction of a user's trust, none of which appear on the invoice.
One warning, and it is the expensive kind. Cost attribution is an instrumentation decision made at build time. Retrofitting it into a system that was never designed to carry the metadata is painful enough that most teams quietly decide not to, which is why so few have it and why so many discover they need it during a budget review.
Which raises the question the invoice cannot answer. How do you know which of those outcomes was successful in the first place.
Output quality, and how to measure hallucination without reading everything
This is the category readers came for, and the one the field handles most vaguely.
Start by being precise about what "hallucination rate" means, because it describes at least three different measurements with different costs and different detectors.
- Groundedness. Is the claim supported by the context that was actually retrieved and passed to the model. Cheap to check when you have the retrieval logs, and it catches the most common RAG failure.
- Factual accuracy. Is the statement true about the world. Expensive, often requires an external source, and is the only one that catches a confidently wrong answer built on correct retrieval.
- Instruction adherence. Did the model do what it was told, in the format it was told to use. Nearly free to check for structured outputs, and it catches a surprising share of production incidents.
Collapse these three into one number and you get a quality metric that moves for reasons nobody can explain.
Then there is the constraint almost nobody states plainly. You cannot evaluate every response with a human. At most production volumes you cannot afford to evaluate every response with a model either. So you sample, and sampling well is a real skill.
Stratify by feature and by user segment so a low-volume, high-stakes path does not disappear into the average. Oversample the cases you have specific reason to distrust: long inputs, unusual topics, sessions that already produced a retry. And hold a small human-labeled set as the calibration anchor for whatever automated judge you deploy.
Using a model as a judge is the practical default at production volume, with one honest caveat. Your judge is itself a non-deterministic system. Without periodic calibration against human labels, you have moved the measurement problem rather than solved it.
Several cheap proxy signals earn their place regardless of how sophisticated your evaluation gets, because they cost almost nothing and they move early:
- Refusal rate, which spikes when a prompt or policy change goes wrong.
- Response length distribution, which shifts noticeably when model behaviour changes.
- Retrieval hit rate, which decays as a corpus goes stale.
- Citation presence, when your feature is supposed to cite and sometimes does not.
- Schema validation failures, which are free for any structured output and are pure signal.
The decision here is concrete: roll back a prompt or model version, or expand the feature to more users. Both are hard to make without a quality number you trust, and the fastest way to find out whether yours is real is to check it against what users do.
User satisfaction, the signal already sitting in your product
Explicit feedback is honest and sparse. Thumbs and star ratings arrive from a small, self-selecting fraction of users, so treat the absence of negative feedback as proof of nothing. A sudden rise in explicit negatives is a different matter. That one is high-precision and worth acting on the same day.
The denser signals are implicit, and most products already emit them without anybody collecting them:
- Regeneration rate. The user asked again because the first answer was not good enough.
- Edit-before-send rate, wherever your feature drafts something a human sends.
- Abandonment mid-response, which is the streaming-era equivalent of a bounce.
- Copy events, which usually indicate the answer was good enough to use.
- Rephrase-and-retry, where the user reformulates the same question.
- Escalation to a human.
Task completion beats sentiment every time. Instrument what the user got done. Whether they felt good about the exchange matters less than whether they finished and stayed finished.
If you wire up exactly one signal in this category, make it escalation-to-human rate. It moves before satisfaction scores do, it is unambiguous, and it usually already sits in your support tooling waiting to be joined against feature usage. It is also a lagging indicator of something that started shifting earlier, upstream, in the data itself.
Drift, and detecting it before the labels arrive
Drift arrives in three forms and they warrant separate detectors.

Input drift is what users send changing over time. Output drift is what the model returns changing for stable inputs. Concept drift is the right answer itself changing because the world did, which is the one no amount of model stability protects you from.
The hard part is the ground-truth lag. For most business features you learn whether an answer was correct weeks later, or never. A 2025 survey of monitoring practice across machine learning systems identifies exactly this gap between what teams monitor and what they can verify in production (arXiv, 2025). So drift detection has to run on distributions rather than on accuracy.
Practical detectors that work without labels:
- Embedding distribution distance on incoming requests, compared against a stable reference window.
- Output length and refusal rate distribution shifts.
- Retrieval hit rate decay, which is the earliest warning that a corpus is going stale.
- Topic mix change over a rolling window, which catches "users started asking about something new."
The vendor checkpoint problem deserves its own paragraph because it is common and barely covered anywhere. When a provider updates a model behind an unchanged model string, your system's behaviour changes without a single line of your code changing. Pin model versions wherever your provider supports it. Treat every provider model update as a change that requires re-evaluation, the same way you would treat a dependency bump. And maintain a fixed golden set that you re-run on a schedule, so you have a yardstick independent of live traffic that does not drift along with it.
Operational health, the part your existing stack already does well
Availability, error and timeout rates, rate limit and quota rejections, queue depth, retry rates, and dependency health across model providers. Familiar territory. Your current tooling probably handles it competently, and this is the one category where you start out ahead.
Two additions specific to AI features.
Provider-side incidents are your incidents, and you will usually detect them before the provider's status page updates. Fallback path activation rate deserves an explicit metric for exactly that reason. A rising fallback rate is the cleanest early signal that your primary provider is degraded.
Then connect this category to the AI-specific signals in the same trace. The operational metrics on their own add nothing you do not already have. The value sits in being able to tell a model problem from an infrastructure problem in one view, at two in the morning, without a cross-team call.
Which is the right moment to ask the question that decides whether anyone is awake at two in the morning at all.
What should actually wake someone up
Collecting a metric and paging on it are separate engineering decisions, and conflating them is how observability programs die.

Most AI signals belong on a review dashboard. Probabilistic signals need different threshold logic than deterministic ones: a single bad response is noise, and a sustained shift in a rate over a window is signal. Alert on distribution changes and sustained deviation across a window.
A tier model worth copying:
Page immediately. Availability loss, error rate spike, cost rate anomaly against a rolling baseline, safety filter breach. These are unambiguous, fast-moving, and actionable at any hour.
Review same day. Quality score decline, drift indicators crossing threshold, escalation rate rising, refusal rate shift. Real signals that almost never need a response inside an hour.
Review weekly. Cost per successful outcome trend, satisfaction trend, sampling audit, golden set re-run results. These inform roadmap.
The failure mode that kills these programs is specific and predictable. A team wires an alert to a noisy quality score. It fires four times in the first fortnight, three of them for nothing. Within a month the channel is muted, and the team is now worse off than if it had never alerted at all, because it believes it has coverage.
Ownership has to be named. Somebody is on the rota for AI quality incidents , and "the team" is not an answer. The pattern that works in practice is platform engineering owning the pipeline and the pager, with a named product or ML owner accountable for the quality SLO itself. In a single-team organisation that collapses to one person holding the pager and a different person holding the quality target, which is the minimum viable version of the same split. The anti-pattern is a shared dashboard that everybody can see and nobody is responsible for.
Starting from nothing on Monday
The gap between reading this and having it running is smaller than it looks, provided the first step is small enough to actually happen.
Week one: trace everything. Every AI call, end to end, with input, output, model version, prompt version, token counts, and latency attached. Decide the retention window and the redaction rules in the same week, because logging full inputs and outputs creates a data-protection obligation whether or not anyone chose it. This is the foundation everything else is built on, and most teams do not have it. The OpenTelemetry project publishes semantic conventions for generative AI systems, which is the emerging standard and is worth adopting rather than inventing your own field names (OpenTelemetry, 2024).
Week two: sample and score. A hundred responses a day, scored by an automated judge, calibrated against thirty human labels. Small and real beats comprehensive and hypothetical, every time.
Week three: one dashboard, three alerts. Resist adding a fourth. The discipline of choosing three is what makes them meaningful.
Week four: name the owner and write the SLO down. A quality target, in a document, with a person's name on it.
What to skip early, which is advice you will not get from a vendor: full embedding drift monitoring, a dedicated observability platform, and per-user cost attribution can all wait until traces and sampling are working. They are the right investments later. They are also a way of not starting now.
Security and compliance signals run on the same traces and the same alert tiers as everything above, and differ in who owns the response rather than in what infrastructure carries them. Prompt injection attempts, PII appearing in outputs, and policy violations are their own detection problem with their own owners, and recent guidance from Microsoft's security team frames AI system observability explicitly as a proactive risk detection capability rather than a purely operational one (Microsoft Security, 2026). Find out where that boundary sits in your organization before an incident forces the question.
The reframe that matters is this. The question is not whether your AI feature works. It is how long it would take you to find out if it stopped. Put a number on that today, honestly, and you have both the argument for doing this work and the baseline to measure it against.
If that number is uncomfortable and you would rather not spend a quarter figuring out where to start, that is the shape of problem our Discovery Sprint is built for. One week, working against your actual features, ending with a concrete plan: which signals matter for what you have shipped, what to instrument first, what to alert on, and who owns the response.