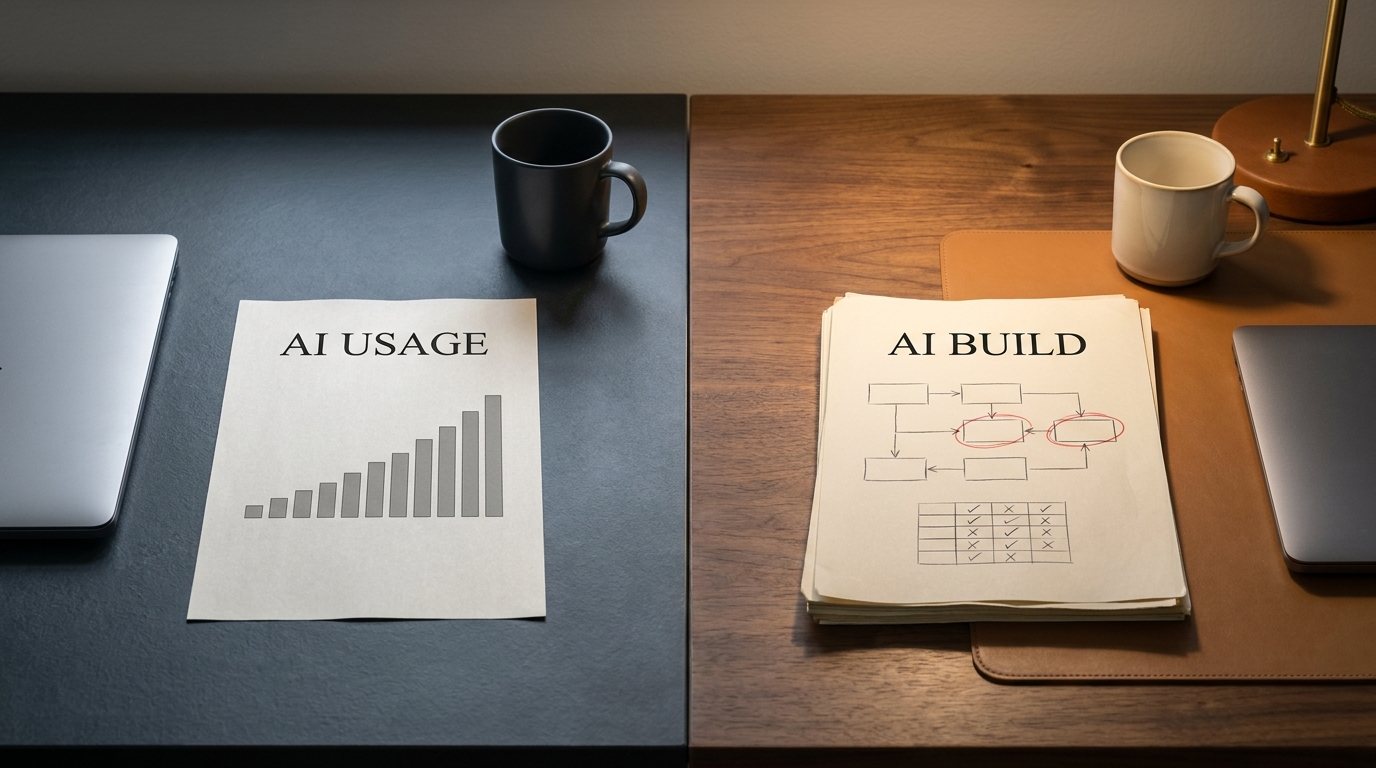

The same tool has been measured making developers 55% faster and 19% slower, and both studies were carefully run.
The first number came from a controlled experiment: developers given GitHub Copilot finished a coding task about 55% faster than the control group (Microsoft Research, 2023). A month-long study inside a live engineering organization found something quieter. Coding time fell 11%. Cycle time fell 5% (Jellyfish, 2024). Both measurements are honest. The gap between them is where most of the money goes.
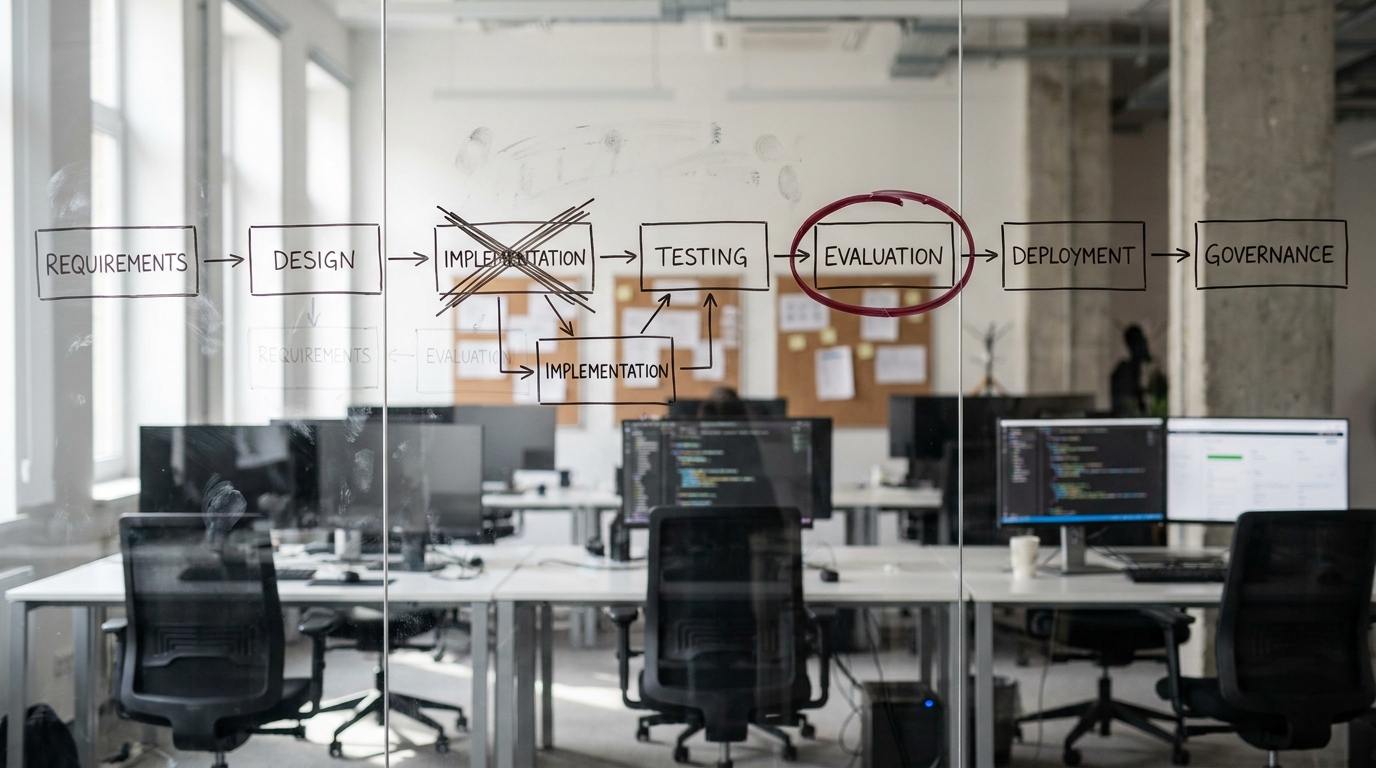
That gap is the whole problem with the way AI coding tools get bought. A license is purchased against the first number and evaluated against the second, and nobody re-plans the system in between. Adoption dashboards go green. Acceptance rates look respectable. The delivery figures your board asks about sit where they were last quarter, and by month four somebody starts asking what the AI line item bought.
The tools work. That was never the issue. Writing code was not your constraint, and removing a non-constraint does not make a system faster. It makes the queue in front of the real constraint longer.
The lab number and the delivery number are both real
The controlled studies measured authoring. That is a genuine result and it should not be waved away. The Microsoft Research experiment (2023) recruited developers to implement an HTTP server in JavaScript as fast as they could, gave half of them Copilot, and measured completion time. Under those conditions the effect was large and it held across skill levels, with the least experienced developers gaining the most.
What that design deliberately excludes is everything that happens to code after it is written. No review queue. No integration. No release train. No senior engineer trying to work out whether the submitted diff does what the author thinks it does.
Move the same tool onto a codebase engineers already know well and the picture can invert: METR (2025) ran a randomized trial with 16 experienced open-source developers across 246 real tasks and measured them taking 19% longer with AI tools allowed, against their own forecast of a 24% speedup, though METR now flags the result as reflecting early-2025 tooling. Jellyfish ran a month-long trial with the engineering team at Bench and found time spent coding dropped roughly twice as much as cycle time did (Jellyfish, 2024). Their reading was that the weight of the work shifted from writing code toward reviewing it. Uplevel studied close to 800 developers and found no significant change in throughput metrics at all, alongside a 41% higher bug rate in the group with Copilot access (Uplevel, 2024). Harness, measuring 50 developers across several months, found the opposite direction: pull requests up 10.6% and cycle time down about three and a half hours (Harness, 2023).
Those results look contradictory until you notice what varies between them. It is not the model. It is what each organization did with the code once it existed. That difference has a location, and it sits downstream of the keyboard.
The bottleneck moved from writing code to validating it
The mechanism is closer to arithmetic than to opinion.
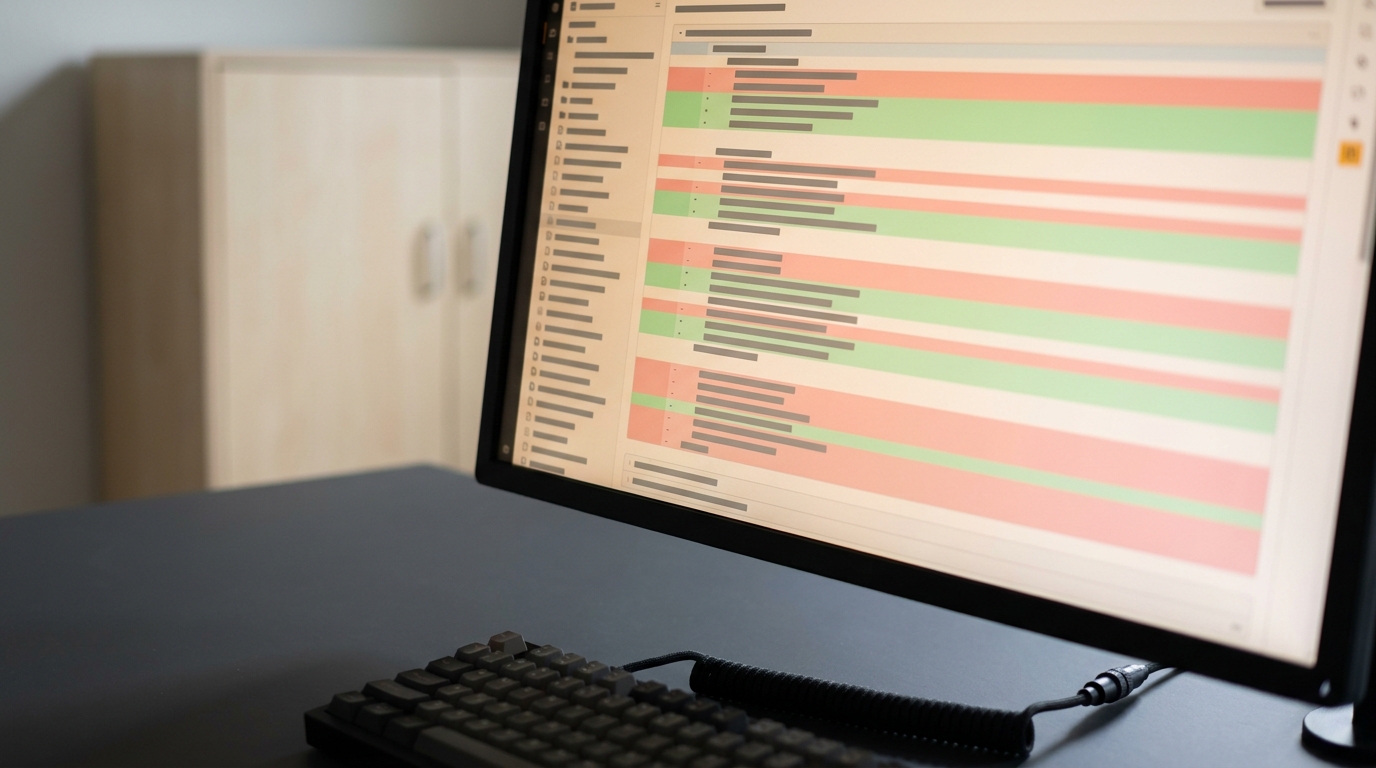
Your engineers now produce more code per week. That part works. Review capacity did not change, because review capacity is a fixed number of senior engineers with a fixed number of hours, and nobody hired more of them when the licenses were approved. So the queue in front of review gets longer, and the time a change spends waiting stops being a rounding error.
The volume increase is not subtle. Swarmia analyzed more than 1,450 engineering organizations and found the median pull request roughly doubled in size between early 2025 and early 2026, with most of that growth arriving in the final six months as agent-based tools went mainstream (Swarmia, 2026). DORA's 2025 research found the same correlation from a different angle: higher AI adoption tracked with larger pull requests and longer code review times.
Bigger changes arriving more often, into the same review capacity. That is a queue getting longer, and cycle time is the metric that reports it.
Three second-order effects make it worse than the queue math suggests.
Review takes longer per unit of code. Reading a diff nobody on your team typed by hand is slower than reading one they did, and the effect is now visible at industry scale: DORA (2025) measured median time in pull request review rising 441% year over year. The reviewer has to reconstruct intent from scratch rather than recognize a colleague's approach. Generated code is often plausible in a way that hand-written code with a bug is not, which means it needs closer reading, not looser.
Review load concentrates. It lands on the same three or four people who were already your constraint, because they are the only ones trusted to catch the failure modes. Their week becomes review, their own delivery stalls, and the organization loses its most experienced output while gaining a lot of junior output.
Standards drift under volume pressure. When the queue is long, the bar slips. The measured version of that is worse than the intuition: DORA (2025) found 31% more pull requests merging with no review at all. That shows up later as reverts, hotfixes, and the kind of defect nobody attributes to the rollout because it surfaced three months after it.
All three are invisible on an adoption dashboard, which is the dashboard most leaders are watching.
How to tell this is happening to you
Run down this list, and count.
- Adoption metrics are healthy and cycle time is flat or worse.
- Pull request volume is up and median merge time is up with it.
- Two or three engineers appear as reviewer on most PRs.
- Revert rate, hotfix rate, or escaped-defect count has crept up since rollout.
- Your senior engineers describe their week as mostly reviewing.
- There is no written answer to "what is the bar for merging AI-generated code."
- Nobody can state, in delivery terms, what the tool changed.
Four or more is the pattern. Be honest about the last two in particular, which are the ones people skip because the answer is uncomfortable to say out loud in a leadership meeting. It is not a tooling problem, and switching vendors will not touch it. Every line on that list traces to one specific missing piece of process.
Root causes, and what each one actually requires
The fix is a change to how the team works, not a change to how the team feels about the tool .
| Symptom you see | What is actually causing it | What has to change | Who owns it |
|---|---|---|---|
| Cycle time flat despite high adoption | Review and release capacity unchanged while authoring capacity rose | Rebalance the system around review: cap work in progress, add reviewers, automate the mechanical layer of review | VP Engineering |
| Review concentrated on 2-3 people | No deliberate distribution of review load, and no trust model for who can approve what | Named review rotation, tiered approval rules by change class, explicit growth path for new reviewers | Engineering manager |
| Bug and revert rate up | Generated code passing a bar written for hand-written code | Updated definition of done, mandatory tests for generated paths, distinct review checklist for AI-authored changes | Tech lead plus QA |
| Every team doing it differently | No written standard, so each team invented one | A single published standard for AI-assisted development, owned and versioned like any other engineering doc | Principal engineer or architect |
| Nobody knows what changed | Measuring tool consumption instead of delivery | Baseline before rollout, then track cycle time split by stage, not acceptance rate | VP Engineering |
| Sensitive code generated unsupervised | No decision rights defined for where the tool may operate | Explicit no-generate zones and human-owned decisions, enforced in review | CTO |
| Uneven results across engineers | Technique was never taught, only access was granted | Pairing, calibration sessions, worked exemplars, continued past week two | Adoption owner |
| Security debt accumulating quietly | Generated dependencies and patterns entering without scrutiny | Security review class for generated code, dependency and license checks in CI | Security lead |
Read the "what has to change" column as the actual project. It is eight process changes, not a procurement decision, and the last four are the ones organizations skip. Start with the instrument, because the other seven cannot be sequenced without it.
Measure delivery, not consumption
Most teams are holding a metric that cannot answer the question being asked of it.

Acceptance rate measures whether a suggestion was useful enough to keep typing from. That is a real signal about the tool, and the research supports it as a proxy for how developers experience their work: the CACM analysis of Copilot telemetry found acceptance rate predicted perceived productivity better than any other usage measure, and that what mattered was whether a suggestion made a good starting point rather than whether it was correct (Communications of the ACM, 2024). It is a good tool metric. It is not a delivery metric, and the moment it becomes a target it stops being either. Uplevel's write-up puts the Goodhart problem plainly: incentivize the number and you get the number.
Stop treating these as evidence of return: seats activated, suggestions accepted, lines generated, percentage of code AI-authored.
Track these instead:
- Cycle time, split by stage. Authoring, review wait, review active, release. This is the single most useful change, because it shows you which segment moved and which did not. An aggregate cycle time hides exactly the effect you are looking for.
- Review wait time and reviewer concentration. How long a PR sits before a human opens it, and how few people are opening them.
- Pull request size distribution. Rising median batch size is an early warning that review is about to degrade.
- Change failure rate and revert rate. The quality side of the ledger, which is where the cost shows up if it shows up at all.
- Rework rate. Code changed again within a short window of merging, which catches plausible-but-wrong output that passed review.
- A developer experience signal. A short recurring survey. It is the cheapest instrument on this list and the first one to get cut, and it is the only one that will tell you your seniors are drowning in review before the delivery numbers do.
Baseline all of it before the next rollout phase. Without a before, the after is an anecdote.
The measurement vendors have done good work here and their material is worth reading directly. Where most of it stops is at the dashboard. Knowing cycle time did not move tells you the return is missing. It does not tell you which of the eight rows in that table to work on. The next three sections are those rows.
Review practices that survive the new volume
Almost nobody has written this part down. It is where the return lives.
State the merge bar explicitly. Not "review carefully." A written rule: AI-generated code is held to the same standard as hand-written code , and the author is accountable for every line as though they wrote it. That sentence does more work than any tool setting.
Make the author the first reviewer. The rule that fixes most of the volume problem is that the submitting engineer must be able to explain any line in the diff, without help, in review. If they cannot explain it, it does not merge. This is unpopular in the room and correct anyway. It moves validation cost back to the person who has the most context and the least excuse, and it stops the pattern where an engineer forwards generated code to a senior for interpretation.
Enforce size limits in CI, not in a wiki. Large diffs are where review quality collapses. If the team agrees on a cap, put it in the pipeline as a warning or a required justification. A guideline nobody enforces is a guideline that erodes at the moment volume rises.
Treat agent-authored changes as their own review class. Different checklist, and often a different reviewer pool. What a reviewer looks for in an agent-generated migration is not what they look for in a colleague's refactor: unnecessary abstraction, silently changed behavior at the edges, tests that assert the implementation rather than the requirement, dependencies added without a reason.
Push the mechanical layer into automation. Formatting, lint, coverage thresholds, dependency and license checks, static analysis. Every one of those a human catches manually is capacity taken from the judgment work only a human can do. This matters more now than it did, because the volume is higher and the failure modes are subtler.
Distribute review deliberately. Publish a rotation. Define which change classes a mid-level engineer can approve alone. Treat growing the reviewer pool as a named objective with a date, not as something that happens when people are ready.
Six practices, and not one of them costs money. What they cost is agreement, which is the subject of the next section.
Standards, definition of done, and who holds the decision rights
Two documents and one decision, and most organizations have none of them.
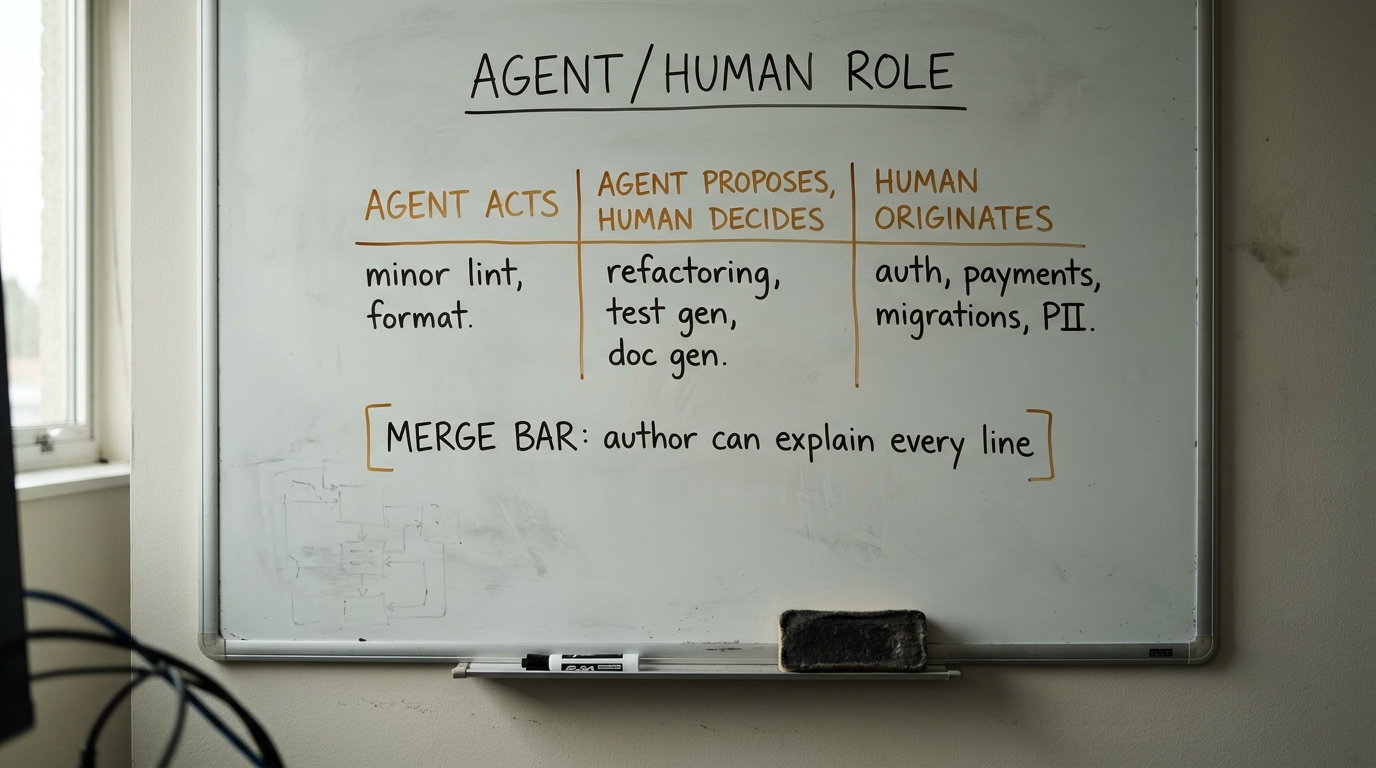
A written standard for AI-assisted development. Short, versioned, and owned by a named person. It should answer: where generated code is fine without special handling, where it needs additional review, what must never be generated without a human writing it, what the testing expectation is for generated paths, and how dependencies introduced by generated code get vetted. The no-generate list is usually short and specific: authentication, authorization, payment handling, schema migrations, anything touching regulated or personal data, anything in the security boundary.
An updated definition of done. The old one assumed a human wrote the code and therefore understood it. That assumption no longer holds. The new one has to add that the author can explain the change, that tests cover the generated paths rather than merely existing alongside them, and that any new dependency has been justified.
Decision rights, stated once. Where an assistant may act freely, where it may propose and a human disposes, and where a human must originate the decision . Write this one early. It is what keeps a coding assistant from becoming an unreviewed contributor to your security-critical paths without anyone ever deciding that it should.
None of these documents is long. The writing takes an afternoon. Getting one version agreed across teams that have each already invented their own is the part that takes a quarter.
Roll it out as change management, not procurement
The evidence on this point is more consistent than the evidence on productivity itself.

Ippon, a consultancy, distributed Copilot to its engineers and watched adoption stall at 30% over the first few months (Ippon, 2025). Access was not the blocker. What moved the number was a structured campaign: a focus group that committed to using the tool daily and met twice a week for a month to share what they had tried, plus written first-hand accounts from the people doing it. What came out of it was a cohort of engineers who could teach the rest of the company what worked.
Microsoft's internal scaling of Copilot followed the same logic and formalized it, publishing an adoption playbook built around named adoption owners on each team, pairing sessions where senior engineers demonstrated when to accept a suggestion and when to rewrite it, and short recurring calibration meetings where a handful of real outputs were reviewed and the resulting rule of thumb was written down and shared. The pattern in both cases is that the tacit knowledge good engineers develop privately gets made explicit and taught, rather than left to diffuse on its own.
Google Cloud reached the same place from the practitioner side after running its own engineers through real migration projects, and their framing is the one line from this literature worth repeating in a leadership meeting: owning a kitchen knife does not make you able to julienne (Google Cloud, 2025). Technique is the variable. Their practices are concrete and worth copying: pick the tool shape that matches the task rather than defaulting to one, document and test the codebase first so the assistant has something to reason from, and build an explicit plan before generating anything on a complex change.
A first 90 days that reflects all of this looks like:
- Weeks 1-2. Baseline the delivery metrics above. Nothing else. You cannot evaluate a change you did not measure before.
- Weeks 2-4. Pick one team. Write the standard and the updated definition of done with them, not for them.
- Weeks 4-6. Change the review practice on that team. Merge bar, author-explains rule, size enforcement in CI, published rotation.
- Weeks 6-10. Run the enablement: pairing, calibration sessions, worked exemplars from your own codebase rather than vendor demos.
- Weeks 10-12. Re-measure against the baseline. Publish what moved and what did not, including the parts that did not work.
- Then expand. Take the standard, the review practice, and the enablement to the next team as a package. Not the license. The license is already there.
Notice how little of that is about the tool. The tool is a precondition. Everything on the list is process, and process is what converts a precondition into a result.
Key takeaways
- The controlled-experiment numbers and the flat delivery numbers are both accurate. They measure different things, and only one of them is what you buy.
- AI coding tools relocate the bottleneck from authoring to review and validation. If review capacity does not change, the queue absorbs the gain.
- Acceptance rate and seat activation measure consumption. Cycle time split by stage, review wait, PR size, and change failure rate measure delivery.
- The differentiating work is a written merge bar, an updated definition of done, explicit decision rights, and a deliberate review-load distribution.
- Every rollout that produced a durable result treated adoption as change management: an owner, a pilot, taught technique, and a measured before and after.
The license was the cheap half of this. The process redesign is the half that produces the return, and it needs senior engineering attention at exactly the moment your senior engineers are buried in a review queue.
That is the bind worth naming out loud. The people best placed to redesign your SDLC are the people the current design is consuming. If you want the redesign to happen this quarter rather than next year, a Fractional Agentic Team gives you embedded senior capacity to write the standard, rebuild the review practice, and run the enablement alongside your team, without waiting on a hire.